Know your numbers.
Grow your value.
Every dollar of EBITDA you improve is worth 8–12x at the sale of your agency. ZenTrendy makes those dollars visible, measurable, and actionable — without adding a single new client.
The Value Proposition
Same revenue. Millions more at exit.
Insurance agencies are valued at 8–12x EBITDA. Every dollar of margin you improve — without adding a single new client — multiplies into enterprise value at sale.
A $3M agency improving EBITDA from 20% to 30% adds $300K in annual earnings and $2.4M–$3.6M in exit value. ZenTrendy is the platform that makes that move visible, measurable, and actionable.
The Math
Most agency owners know their revenue. Almost none can quickly name their EBITDA margin, cost structure, or trajectory. ZenTrendy closes that gap.
Financial Intelligence Layer
Not a dashboard. A financial barometer.
ZenTrendy is not another reporting tool. It is a financial and operational intelligence platform that helps agency owners and leadership teams truly understand the health of their business — not just view it.
Upload your monthly financials, and ZenTrendy surfaces the P&L insights, EBITDA trends, producer performance gaps, and operational red flags that drive better decisions and grow agency value. When layered onto ZenClaims, ZenTrendy connects operational performance to claims outcomes — giving agency leaders a complete picture of health, not just activity.
The Problem
Most agency owners don't know what they don't know.
The financial truth of most agencies is buried in spreadsheets, disconnected reports, and manual processes. ZenTrendy surfaces what matters — before it becomes a crisis.
60% of agency owners can't name their EBITDA margin
MarshBerry 2024: most owners know their revenue. Almost none can quickly name their margin, cost structure, or trajectory. That gap costs an estimated $300K per year in missed optimization.
1 in 3 agencies has no monthly financial review
Club Capital 2025: without continuous monitoring, expense creep, producer underperformance, and margin compression go undetected until they become material. By then, the damage is done.
Every EBITDA dollar is worth 10x at exit
At 8–12x EBITDA multiples, a $100K improvement in annual earnings adds $800K–$1.2M to enterprise value. Most agencies leave that money on the table because they never see the numbers clearly.
Multi-location owners fly blind
Agencies with multiple locations or hierarchies have no consolidated view of operational health. Each entity is managed in isolation, making portfolio-level decisions nearly impossible.
Financial Visibility
From raw financials to operational clarity.
ZenTrendy transforms monthly financial uploads into a structured, intelligent view of your agency's health — automatically, every month.
Upload your monthly financials
Connect or upload your monthly P&L, income statement, and expense data through a simple, structured intake workflow. No complex integrations required.
ZenTrendy structures the data
The platform normalizes and structures your financial data into a consistent model — giving you a clean, comparable view across months, quarters, and years.
Insights surface automatically
Revenue trends, margin movements, expense variances, and performance anomalies are surfaced automatically — no manual analysis required.
Act on what matters
ZenTrendy translates financial data into operational clarity — helping agency leaders make faster, better-informed decisions about growth, cost, and people.
Financial Intelligence
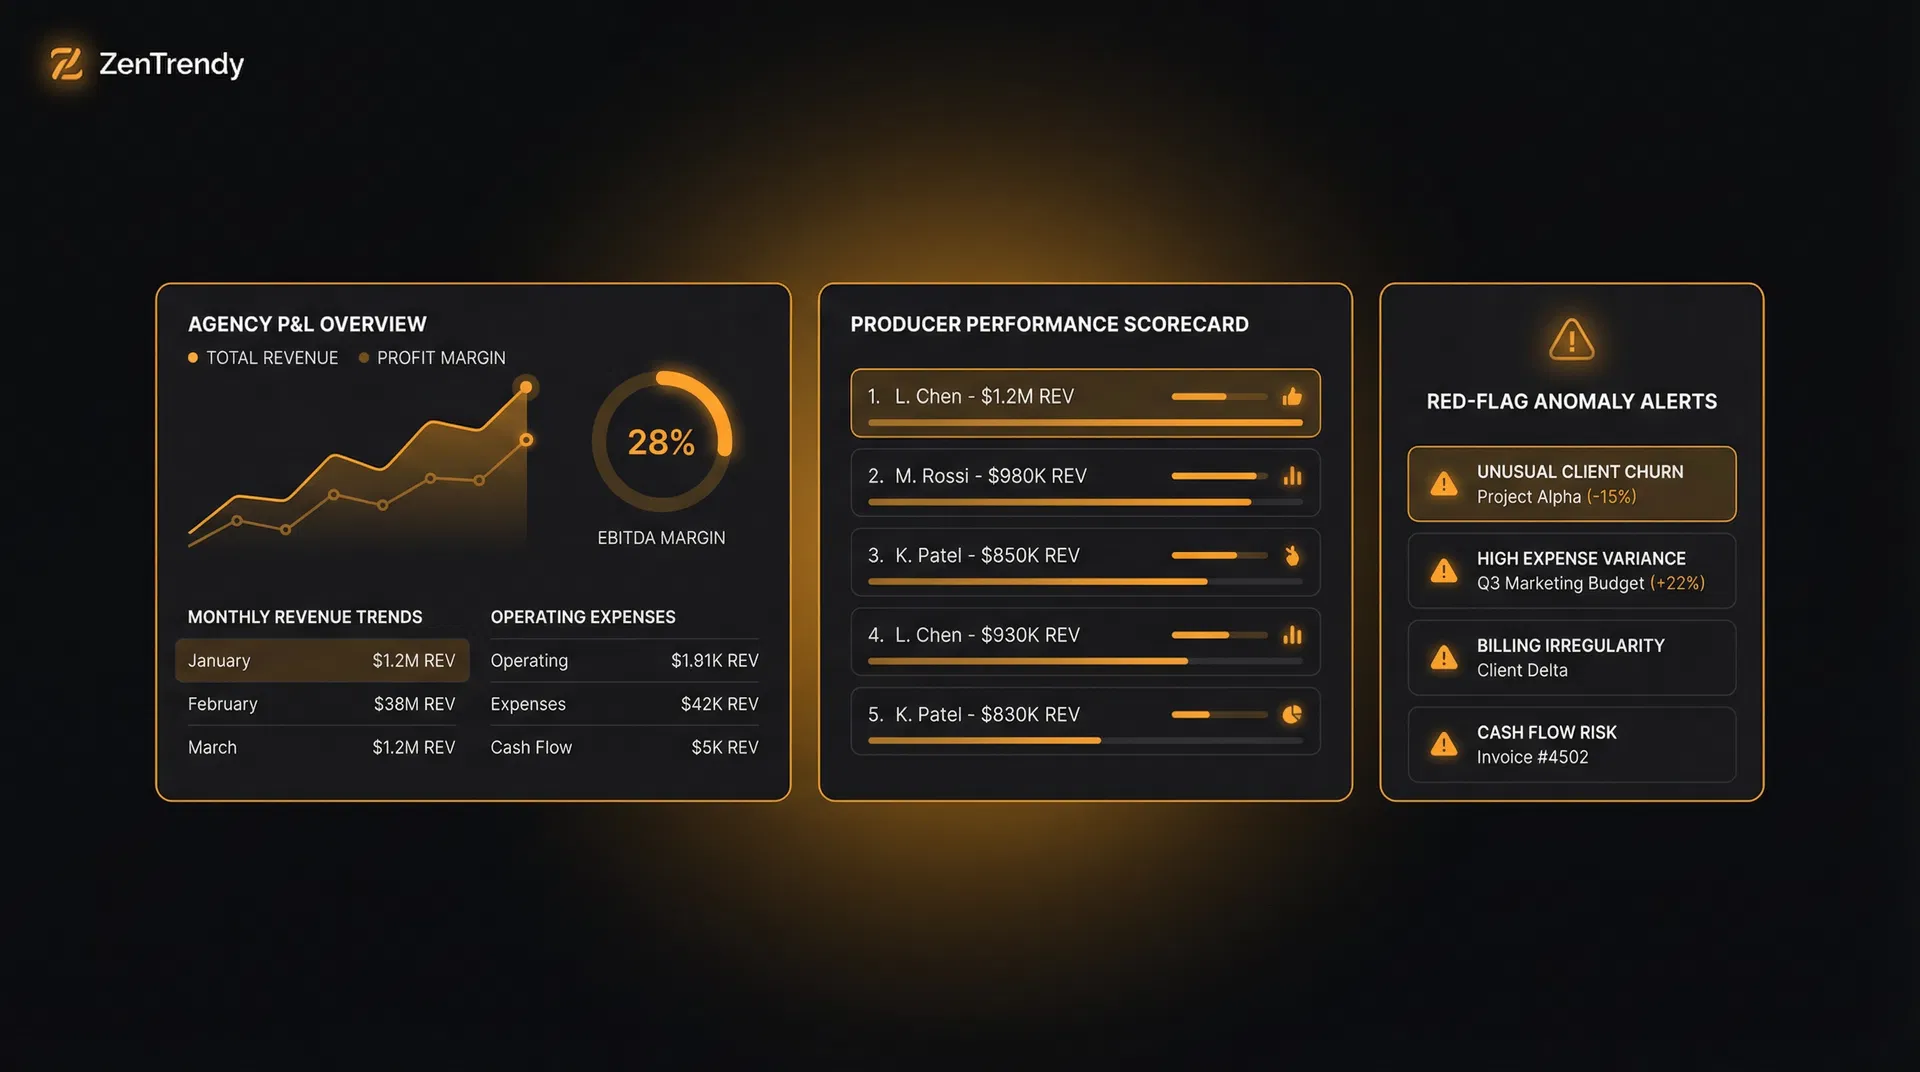
The numbers that actually matter.
ZenTrendy surfaces the financial metrics that determine agency health — not just revenue, but the margins, trends, and producer dynamics that drive long-term value.
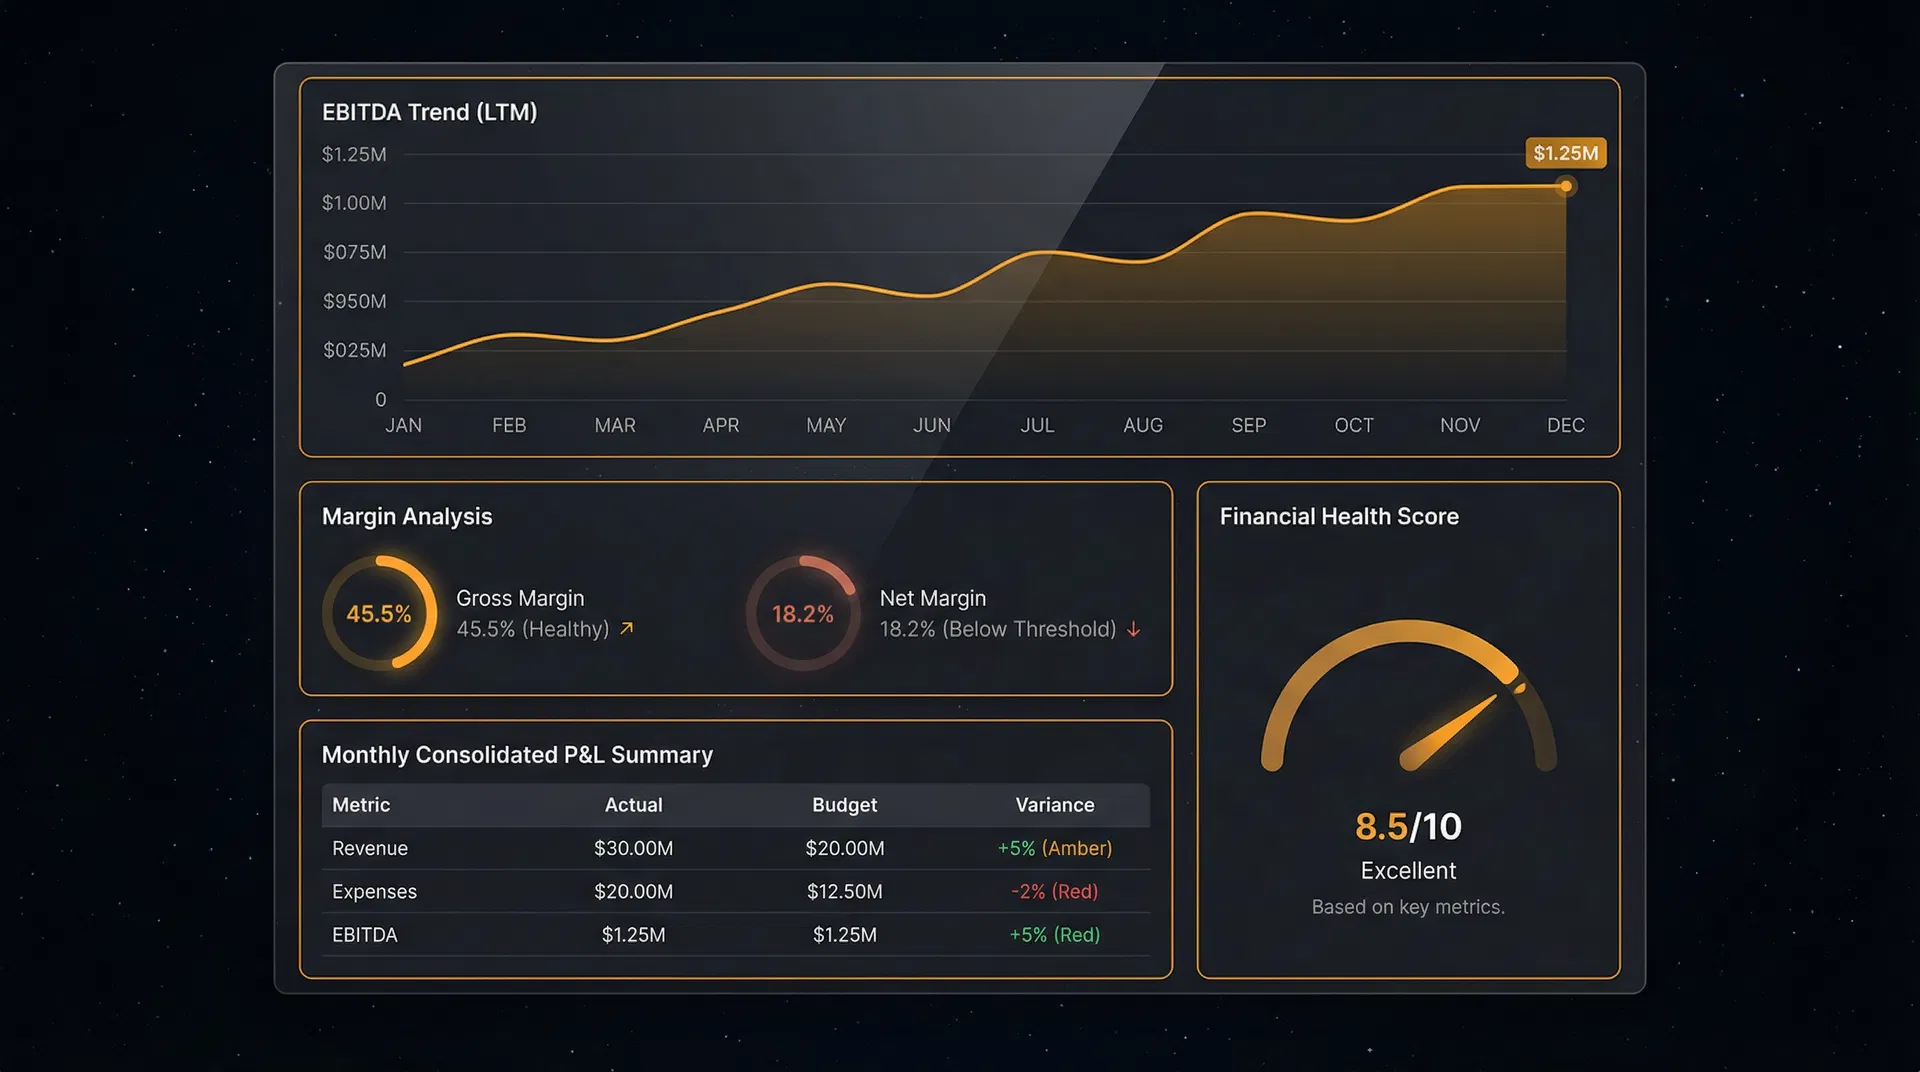
EBITDA Tracking
Monitor your agency's EBITDA on a rolling 12-month basis. Understand whether your earnings trajectory is healthy, flat, or declining — and why.
Trailing 12-month view. Month-over-month variance. Budget vs. actual comparison.
Margin Intelligence
Track gross margin, net margin, and operating margin across the business. Surface compression before it becomes a structural problem.
Gross / net / operating margin. Threshold alerts. Historical trend overlay.
Producer Performance
Rank producers by revenue, growth rate, and retention. Identify top performers, underperformers, and at-risk producers — before they leave or plateau.
Revenue by producer. Growth rate ranking. Retention and churn signals.
Expense Visibility
Understand where money is going. Track compensation ratios, overhead, and discretionary spend against revenue benchmarks and prior periods.
Compensation ratio. Overhead as % of revenue. Period-over-period variance.
Red Flags & Scorecards
Surface the truth. Before it costs you.
ZenTrendy monitors your agency's financial and operational signals continuously, surfacing anomalies and scoring performance against your own thresholds — not industry averages.
Unusual client churn
A producer's book is declining faster than the agency average. ZenTrendy flags the anomaly before it becomes a retention crisis.
Margin compression detected
Revenue is growing but net margin is declining. ZenTrendy surfaces the divergence and traces it to the expense category driving it.
Compensation ratio above threshold
Total compensation as a percentage of revenue has crossed the agency's defined threshold. A scorecard alert is triggered for leadership review.
Producer performance plateau
A previously growing producer has shown flat revenue for three consecutive months. ZenTrendy flags the trend for a performance conversation.
Expense variance within normal range
Month-over-month expense variance is within the defined tolerance. No action required — the scorecard confirms the agency is operating as expected.
EBITDA on target
Trailing 12-month EBITDA is tracking within 2% of the agency's plan. ZenTrendy confirms the business is financially healthy.
Portfolio Intelligence
Built for owners who run more than one agency.
ZenTrendy supports the full ownership hierarchy — from single-location independents to regional operators and holding company structures.
Multi-location consolidation
Aggregate financial data across all agency locations into a single consolidated view — without losing the ability to drill into each entity individually.
Entity-level benchmarking
Compare performance across locations, divisions, or ownership groups. Identify which entities are driving value and which require intervention.
Hierarchical reporting
Support regional managers, holding company owners, and portfolio operators with role-appropriate views of the financial hierarchy.
Ownership and M&A readiness
ZenTrendy maintains the financial documentation and trend history that supports agency valuation, acquisition due diligence, and ownership transitions.
Business Impact
The math is simple.
A $3M agency improving EBITDA from 20% to 30% moves from $600K to $900K in annual earnings. At an 8–12x multiple, that is a $2.4M–$3.6M increase in enterprise value — from the same revenue. ZenTrendy makes that move visible, measurable, and actionable.
Three Report Types. One Platform.
Executive summary of agency financial health. One page. Built for the owner.
Multi-entity view for regional operators and holding companies.
Full operational detail for internal leadership review.
Built For Every Agency Structure.
Single-location independent agency. Needs clarity on margins, producers, and trajectory.
Multi-location operator. Needs consolidated view plus entity-level drill-down.
Holding company or aggregator. Needs portfolio intelligence and M&A-ready documentation.
ZenTrendy pays for itself in month one. Monthly reviews that took 4–6 hours now take 15 minutes.
Financial Intelligence Layer
Stop running your agency on instinct.
See how ZenTrendy transforms monthly financials into the operational clarity that drives better decisions, stronger performance, and growing agency value.
ZenClaims runs the operating core. ZenTrendy wraps it with financial and operational intelligence — helping agency leaders understand performance, health, and value around the platform that runs their claims.
Explore ZenClaims